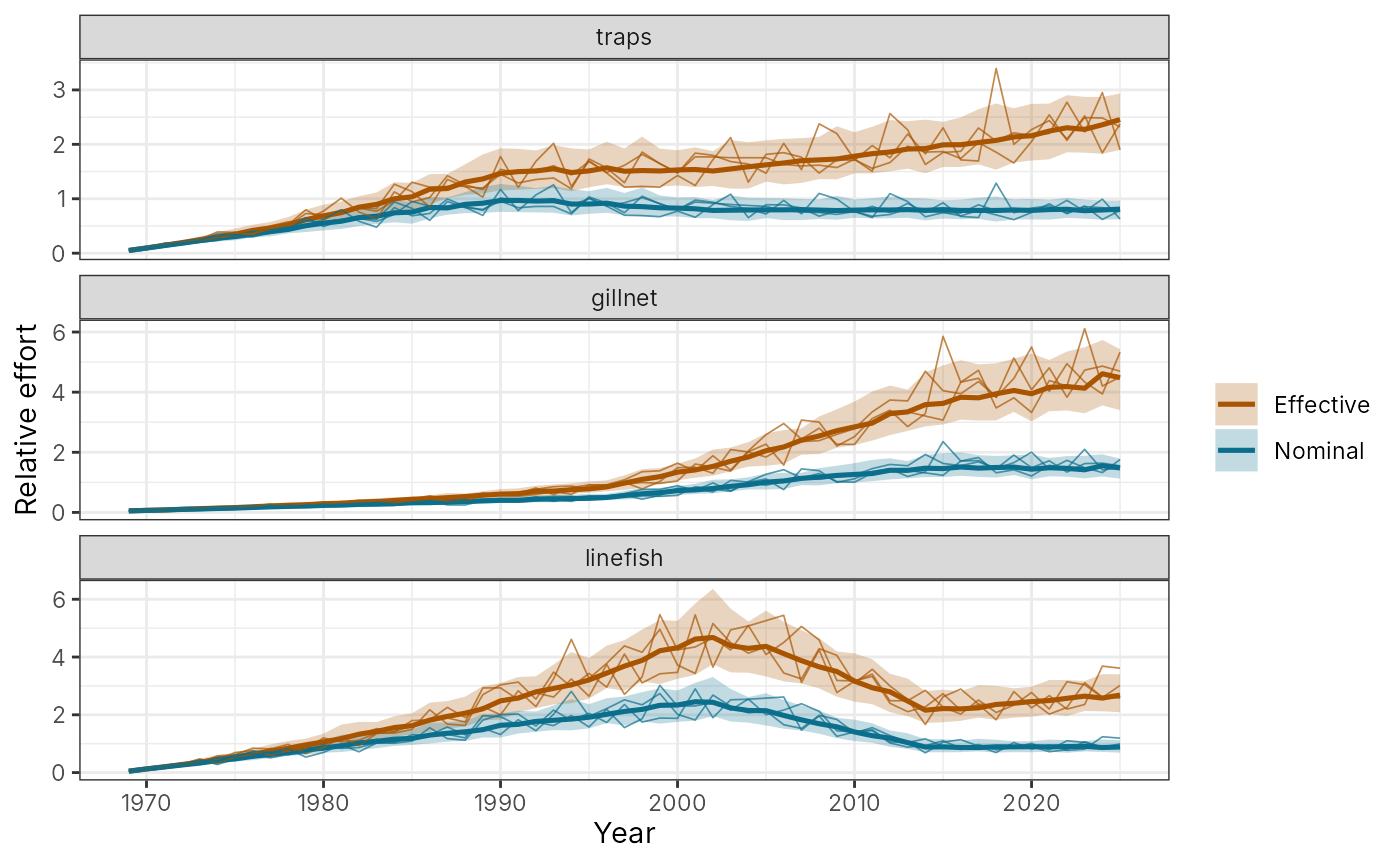
Median and 90% interval of nominal effort by fleet, with a few individual
iterations. With efficiency = TRUE the effective effort (nominal x
efficiency) is shown as well, to visualise effort creep.
Arguments
- x
a
fishery()(effort is simulated) or afloss_om.- nsim
iterations to simulate when
xis a fishery.- iters
iterations drawn as lines.
- efficiency
also show effective effort.
Examples
plot_effort(reef_fishery(creep = 0.02), efficiency = TRUE)