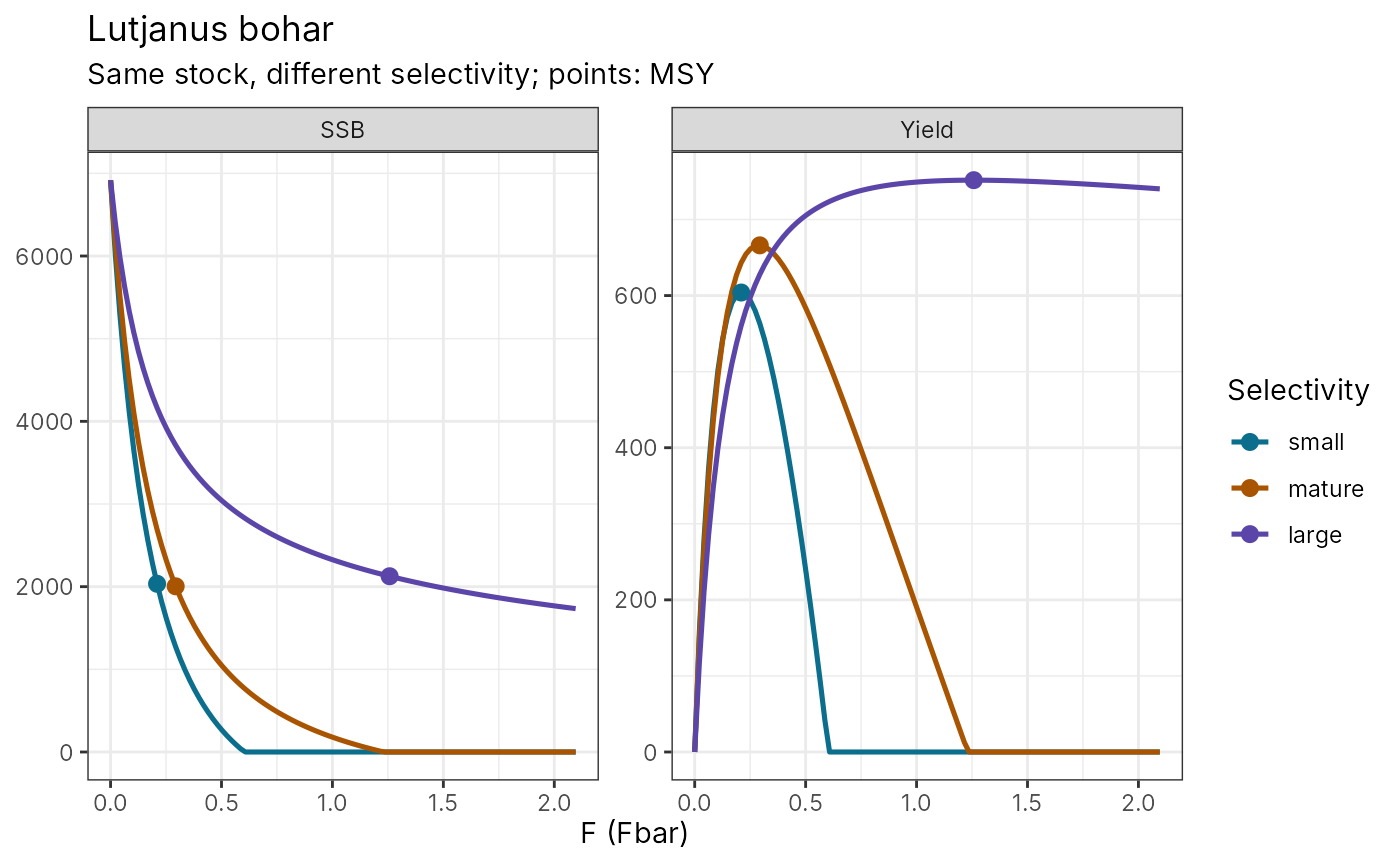
The same stock (life history, recruitment, unfished biomass) fished with different selectivities: equilibrium yield and SSB against F (Fbar). Catching fish before they have grown lowers the maximum yield and the F at which it is reached (growth overfishing); protecting small fish raises both. Points mark MSY for each selectivity.
Arguments
- sp
a
species().- sels
named list of
selectivity()objects.- fmax
largest F shown, as a multiple of Fmsy of the species' own (joint) selectivity.
Examples
# \donttest{
sp <- load_species("lutjanus_bohar")
plot_eq_selectivity(sp, list(
small = selectivity("logistic", L50 = 25, L95 = 30),
mature = selectivity("logistic", L50 = 35, L95 = 42),
large = selectivity("logistic", L50 = 50, L95 = 58)))
 # }