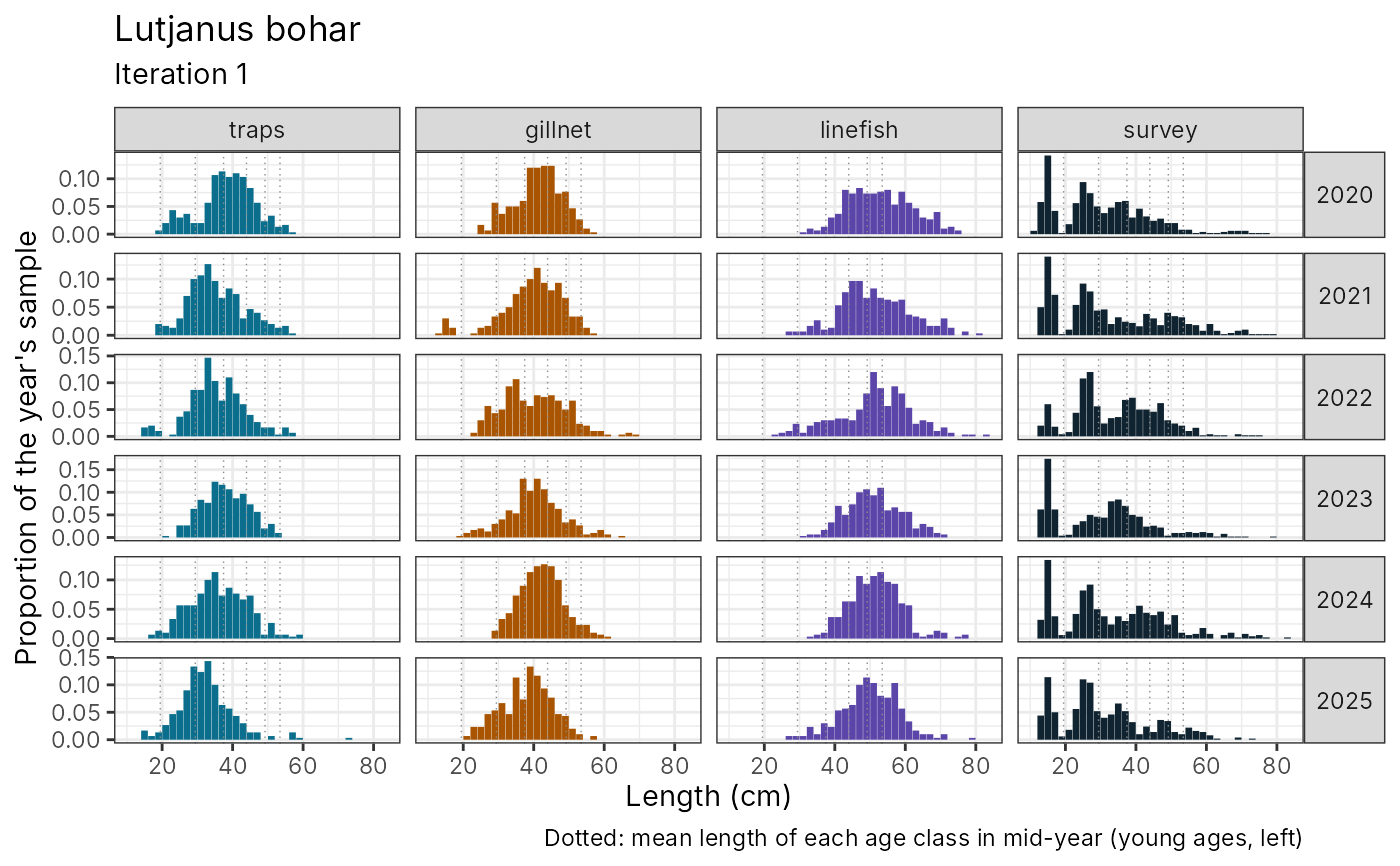
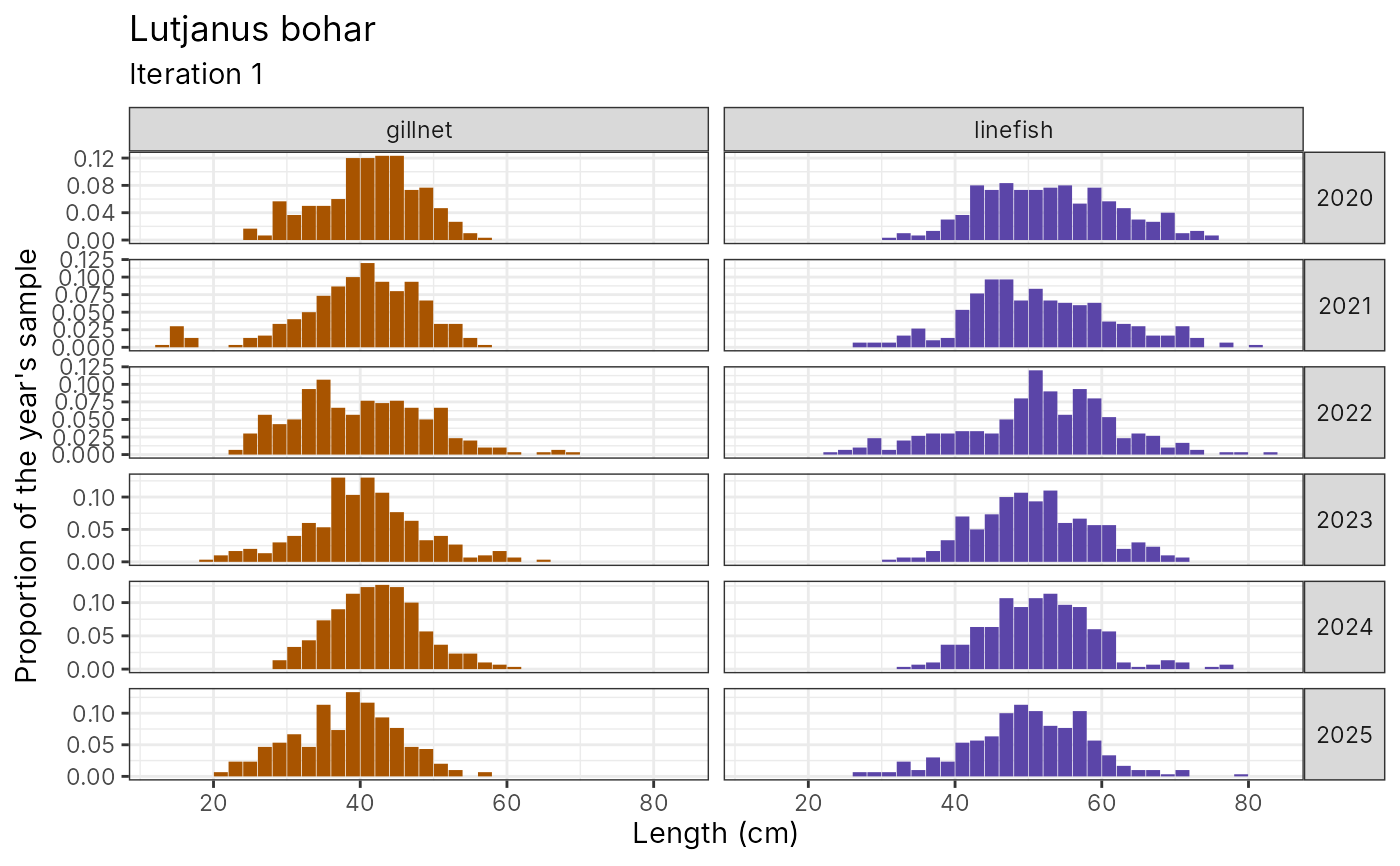
type = "bars"(default): the classic length-frequency histogram, one panel per year (rows) and source (columns), see below.type = "ridge": one length distribution per year, drawn as a ridge along the time axis (as FLRef'splot_lfd_ridgeline()), one panel per source; withcohorts = TRUE, von Bertalanffy lines follow each year class, so modes can be followed along them.type = "bubble": one row per year, bubble area = proportion of the year's sample at each length. Withcohorts = TRUE, von Bertalanffy growth lines follow each year class through the samples: real modes move along these lines; patterns that jump or vanish are sampling noise or selectivity, not dynamics.type = "bars": the classic length-frequency histogram, one panel per year (rows) and source (columns), as proportions of each year's sample. Withcohorts = TRUE, the mean length of each age class in that year is marked at the top, so modes can be matched to year classes.
Usage
plot_lfd(
  data,
  species = NULL,
  iter = 1,
  source = NULL,
  type = c("bars", "ridge", "bubble"),
  years = NULL,
  cohorts = FALSE,
  season = NULL,
  lfd = NULL,
  by_season = FALSE
)
Arguments
- data
a
floss_data(orread_dataset()list).- species
species name; default the first.
- iter
iteration(s); several iterations are overlaid (lines) or shown in rows (length samples).
- source
fleets / survey to show; default all.
- type
"bars","ridge"or"bubble".- years
years to show; default the last six for
"bars", all for"ridge"and"bubble".- cohorts
add cohort growth lines (bubble) or age-class marks (bars).
- season
seasons to include; default all.
- lfd
optional length table to plot instead of
data$lfd, e.g. fromlfd_aggregate()(pooled over fleets or raised to the catch).- by_season
show the seasons separately instead of pooling them.
Details
Seasonal samples are pooled for the year (counts summed), unless
by_season = TRUE: then each season is shown separately (histogram: a
panel per year and season; ridge: one ridge per season within the year,
coloured by season, as FLRef's plot_lfd_ridgeline() with seasonal data;
bubble: seasons stacked within the year). Fish grow through the year, so
modes move to the right from season to season; with imbalanced sampling
(season_design()) some seasons have few or no samples.
Examples
# \donttest{
x <- simulate_fishery("lutjanus_bohar", nsim = 2, iters = 1)
plot_lfd(x$data, cohorts = TRUE)
 plot_lfd(x$data, type = "bars", source = c("gillnet", "linefish"))
 # }